 DeckCoderAI
← Slide gallery
03 / Explain a change in the data
Waiting times fell
Read six months of waiting times, then reveal the change and the target.
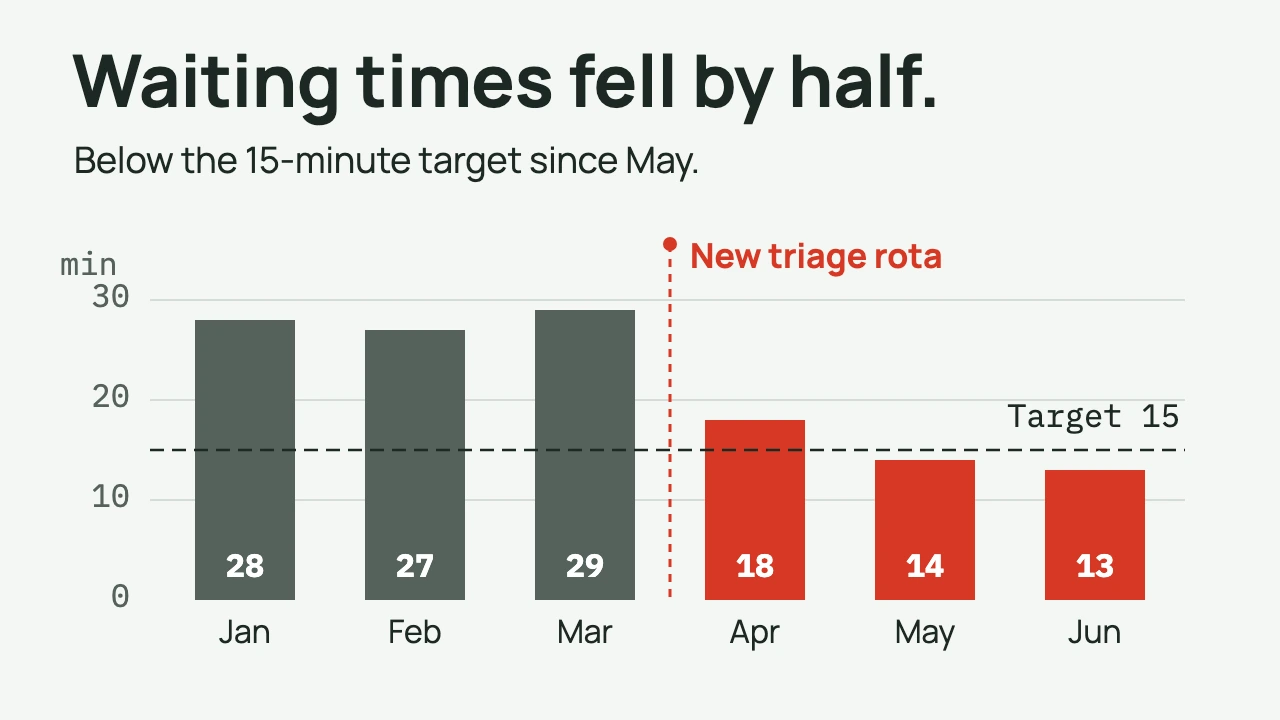
Select Next to mark the April change, then again to show the 15-minute target. The figures are illustrative.
Make a similar slide
Give this prompt to the agent helping you with your presentation.